- This topic is empty.
-
AuthorPosts
-
2026-10-23 at 4:27 pm #13458
An industrial flow sensor reads incorrectly or unstably for three separable reason families: the flow conditions at the sensor are not what the application assumes (partially filled pipe, air bubbles, disturbed flow profile from nearby bends and valves, flow outside the calibrated range), the installation is wrong for the principle (orientation, straight-run lengths, seals protruding into the stream), or the signal chain distorts an honest measurement (scaling errors, wiring faults, noise). The first safe check is comparative: read the sensor against a reference method at the same moment — a trusted second instrument, a pump/valve state known to produce a known flow, or a volume-time check where the process permits. Flow lines are pressure systems: isolation, venting and any in-line work follow the site’s process-safety procedures and belong to qualified personnel.
Key Takeaways
- Separate process, installation and signal before touching the sensor. The comparison worksheet below does exactly that: reference reading, process state and raw signal — a fault shows in one of the three, and the fix belongs to that family.
- Partially filled pipe is the classic instability. Gravity lines and insufficient back-pressure let the pipe run partly empty; most flow principles assume a full pipe, and their readings wander exactly when it is not.
- Installation rules are principle-specific. Straight-run lengths, mounting orientation and full-pipe requirements differ across impeller, float, ultrasonic and hot-wire principles — the installed model’s documentation governs; the selection-side logic is in the flow selection guide (flow-sensor selection guide).
- Scaling errors are perfect impostors. A wrong range constant or unit in the controller multiplies an honest signal into a wrong reading at every flow — check scaling before condemning the instrument.
- Bubbles and profile disturbances produce real signals, wrong values. The sensor faithfully reports a disturbed measurement; the fix is process or installation, not adjustment.
Symptom / Likely Cause / Safe Check Table
Symptom Likely cause Safe check Reading jumps around, gravity/downhill line Partially filled pipe Check line high points, back-pressure arrangement (desk review of the P&ID); compare reading behavior between flow states Reading high/low consistently at all flows Scaling/range constant error; calibration shift Reference comparison at two flow points: constant ratio error → scaling; constant offset → zero/installation family Erratic only with pump running near certain speeds Cavitation/aeration at the pump; pulsating flow Correlate with pump speed and suction conditions; listen per site practice Unstable since a pipe modification Flow-profile disturbance (new bend/valve upstream); orientation changed Compare current upstream/downstream geometry against the model’s installation requirements Zero or minimum flow reads non-zero Bubbles entrained at low flow; offset; mounting orientation wrong for principle Orientation check against the manual; observe at known zero flow (pump off, valve closed per procedure) Signal unstable at the controller, stable at the sensor (local display) Signal path: wiring, noise, scaling Compare local indication vs. controller value at the same moment (https://www.kjt-sensors.com/show-27188.html method) Reading drifts over weeks Buildup/fouling inside the pipe changing the profile or the sensor’s geometry Trend vs. operating hours; review maintenance history for fouling tendency of the medium Safety Boundary
Safe observations and desk work: reference comparisons from existing displays and readings; P&ID review of line arrangement, back-pressure and installation geometry; correlation of instability with pump/valve states from logs; scaling checks from documentation.
Qualified-person / procedural work: any in-line work (isolation, removal, cleaning, resealing); measurements on energized signal loops; venting or manipulating pressurized lines. Flow lines are pressure systems — full process-safety procedures apply.
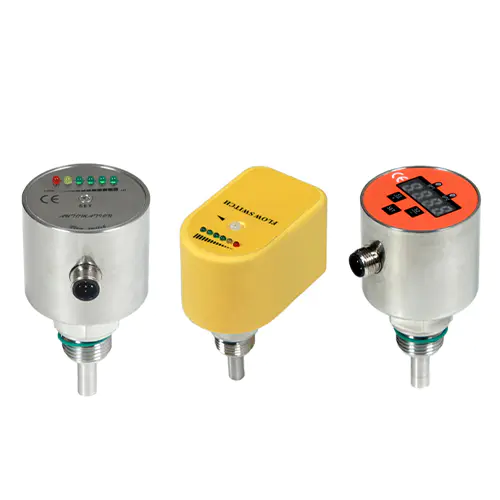
Inputs to Collect Before Changing Settings
- Sensor model, principle (impeller, float, ultrasonic, hot-wire) and its installation requirements from the documentation;
- Pipe data: diameter, material, orientation, upstream/downstream geometry, where the sensor sits relative to bends/valves/pumps;
- Medium: liquid or gas, temperature, pressure, bubble/solid tendency, fouling character;
- The reference method available for comparison and its own accuracy basis;
- Signal chain: output type, controller scaling constants, wiring route;
- Fault history: since when, after what change, at which flow states it appears.
The Reference / Process / Signal Comparison Worksheet
Three columns, taken at the same moment, at a low-flow and a high-flow operating point:
- Reference value — from a trusted second instrument or a process-verified method (volume-time where permitted);
- Process state — pump speed, valve positions, line pressure, known full-pipe status;
- Signal value — the sensor’s local indication (raw) and the controller’s scaled value.
Reading the result: reference ≠ signal at both points with a constant ratio → scaling or calibration family; reference ≠ signal only at low flow (or only turbulent states) → range/profile/bubble family; signal raw stable but controller value wrong → signal chain; everything agrees but the process “expects” otherwise → the process expectation is the fault.
Diagnostic Sequence (Least Invasive to Specialized)
- Observation: reading incorrect or unstable. Hypothesis: one of three families. Check: complete the worksheet at two flow points. Expected result: the fault localizes to scaling, process/flow-condition or signal-chain. Next action: follow the matching step below.
- Observation: constant-ratio error at both points. Hypothesis: scaling/range constants wrong (or calibration shifted). Check: verify sensor range and output span against the controller’s scaling constants, on paper. Expected result: mismatch found (classic after model substitution or program changes). Next action: correct the constants; re-verify with the worksheet.
- Observation: unstable on gravity/downhill or low-back-pressure lines. Hypothesis: partially filled pipe. Check: P&ID review of line profile and back-pressure; observe whether instability correlates with low-flow/low-load states. Expected result: line arrangement permits part-full running. Next action: restore full-pipe conditions per process design (back-pressure, line routing) — a process fix, not a sensor fix.
- Observation: instability correlates with pump operation. Hypothesis: pulsation, cavitation or entrained air. Check: correlate with pump speed/suction state; review suction-line design (desk). Expected result: correlation with specific pump conditions. Next action: process-side correction per process engineering; damping options only per the model manual afterwards.
- Observation: problems began after pipe work near the sensor. Hypothesis: disturbed flow profile or changed orientation. Check: compare current geometry with the model’s stated straight-run/orientation requirements. Expected result: a bend/valve now sits inside the required straight run, or orientation is wrong for the principle. Next action: relocate the sensor per the installation requirements (qualified in-line work).
- Observation: raw local indication stable, controller value wrong. Hypothesis: signal-chain fault. Check: parallel comparison of local vs. controller values; verify wiring and scaling. Expected result: divergence isolated to the loop. Next action: signal-path diagnosis (intermittent-PLC-input troubleshooting guide); interface properties for the loop in interface-selection guide.
- Observation: slow drift over weeks. Hypothesis: internal buildup changing the measurement geometry. Check: trend vs. operating hours and medium fouling tendency; schedule inspection under isolation. Expected result: fouling confirmed at inspection. Next action: cleaning and an inspection interval from the fouling rate; material/buildup considerations route to the selection guide (flow-sensor selection guide).
Conditional Corrective Actions
- Scaling mismatch confirmed → correct the constants and document; add the worksheet to the maintenance record.
- Part-full pipe → restore full-pipe hydraulics per process design; if the line legitimately runs part-full at times, discuss a principle suited to that condition via flow-sensor selection guide.
- Profile disturbance → relocate per the installation requirements; never compensate with calibration — you would calibrate one flow state and corrupt the rest.
- Pump-induced pulsation/air → process-side fix; then damping per the manual within control needs.
- Signal chain → per intermittent-PLC-input troubleshooting guide; replacement accessories follow the equivalence discipline (cable-or-bracket replacement topic).
- Fouling → cleaning schedule from the observed rate; fouling-prone media belong to the selection discussion (flow-sensor selection guide).
Replacement and Reselection Criteria
Reselect when the medium (bubbles, solids, fouling) or the hydraulics (part-full lines, pulsation that cannot be damped) sit outside the installed principle’s documented comfort; when the required flow range exceeds the installed model’s range (check the range-class and minimum-flow discussions in flow-sensor selection guide); or when installation requirements (straight runs, orientation) cannot be met at any position on the line. Selection runs through the flow-sensor selection guide (flow-sensor selection guide) with the application checklist’s data set (application-information checklist).
Information to Send KJT Sensors Support
- Sensor model and principle; installation position with pipe geometry (photos/P&ID excerpt);
- Medium data: liquid/gas, temperature, pressure, bubble/solid content, fouling tendency;
- The completed worksheet (reference/process/signal at two flow points);
- Fault history and correlation with pump/valve states;
- Signal chain: output type, scaling constants, wiring route;
- Maintenance history (cleaning, previous calibration).
Limitations
- Straight-run, orientation, range and damping values are model-specific: every requirement references the installed model’s documentation — none is quoted here.
- KJT Sensors’ flow offering spans impeller, float, ultrasonic and hot-wire directions (manufacturer-stated, family level); the suitability of a specific principle for a specific line is a model-level confirmation.
- Process-side fixes (pumps, line routing, back-pressure) belong to process engineering — this guide only localizes the fault family.
Frequently Asked Questions
Why is an industrial flow-sensor reading unstable?
Most often because the measurement conditions are unstable: a partly filled pipe (the classic), pulsating flow from pumps, entrained air, or a flow profile disturbed by bends and valves too close to the sensor. Installation faults (wrong orientation, protruding seals) and signal-chain errors (scaling, wiring) produce the other families. The comparison worksheet separates them in one pass — reference, process state, signal at the same moment.
How do bubbles and pipe installation affect flow measurement?
Bubbles change the medium the sensor calibrates against — velocity readings shift, ultrasonic paths scatter, low-flow readings go erratic. Installation effects work through the flow profile: bends, valves and pumps upstream leave swirl and asymmetry that a sensor installed too close measures as flow error. Both are real signals about wrong conditions: fix the hydraulics (degassing, straight runs, orientation per the model’s requirements), not the calibration.
How can I distinguish process variation from signal-scaling error?
With the worksheet at two flow points. Scaling errors are proportional and constant — the same ratio error at low and high flow, on an otherwise stable signal. Process variation is conditional — appears at specific states (pump speeds, part-full running, turbulence) and disappears at others. If the raw local indication agrees with a reference while the controller value is wrong, the fault is purely in the chain between them (intermittent-PLC-input troubleshooting guide).
Conclusion
Flow reading faults localize into three families — process/flow conditions, installation, and signal chain — and the reference/process/signal worksheet separates them safely, at two flow points, without touching the line. Fix the family you find: hydraulics and profile problems are process engineering, scaling is documentation, signal paths are qualified electrical work. Principles and models are reselected through the flow selection guide when the medium or the line defeats the installed one.
Sources
- KJT Sensors, Measuring Sensors category (flow-sensor family within the measuring portfolio; verified 2026-10-10) — https://www.kjt-sensors.com/list-clcgq.html
- KJT Sensors, Service & Support — https://www.kjt-sensors.com/list-services.html (verified 2026-10-10)
- KJT Sensors internal knowledge base: measuring sensors — flow-sensor section (impeller, float, ultrasonic and hot-wire directions; medium/pipe/installation/output selection guidance; cooling-water and gas-flow applications; manufacturer-stated) — version current at drafting
- General flow-instrumentation practice (full-pipe assumption, straight runs, profile effects, scaling; no third-party claims)
Send Pipe, Medium and Signal Data
Provide the completed worksheet, the pipe geometry around the sensor, the medium description and the scaling constants via the KJT Sensors service page — process application engineers will identify the fault family and confirm the configuration path or a model-level recommendation.
https://www.kjt-sensors.com/
KJT Sensors -
AuthorPosts

- You must be logged in to reply to this topic.